
Pat Stahl | November 2, 2016
The Horizon Calculator started with a straightforward question: how far can I see? While hiking in Schunmunk State Park this fall, I found myself looking out at the valley and wondering about how far I could see.
I wanted to explore the relationship between observers over long distances and figured there would be a constant to use for the curve of the earth. As always the project snowballed to include terrain between observers. It being Autumn in NYC, I thought thought about the microwave links I used at WABC during the NYC Marathon and other major events such as the Pride March or Breaking News. Nothing replaces on the ground testing but now I wanted to build a simple tool to help planning live events.
The result is the Horizon Calculator, now available as v2.0 :-) It combines horizon estimates, terrain, and analyzes the path between two locations. Getting there involved several development iterations, a substantial amount of testing and repeated reminders that a plausible result deserves another look
Starting with antenna height
The first prototype focused on the natural horizon math. By entering the transmitting and receiving location and height you could calculate how Earth’s curvature affects visibility between them. That provided a useful starting point.
As variables grew I started making minor corrections such as for the assumptions on an antenna’s radiation center above ground, instead of assuming that the top of a registered tower is where the antenna sits. A tower record and an antenna installation describe different things.
The prototype also established how the tool would communicate with a separate data service. An illustrative tower record let us test the request and response before connecting the imported FCC records. By the v1.9 baseline, the calculator brought together the horizon math, manual inputs and FCC tower lookup. Terrain and population were still future work.
Building with AI
I used ChatGPT as a development partner for coding, debugging and working through revisions. I brought the operating context, how it should be built, and what results were helpful. I started with manual entries to keep things simple.
The examples below became some of the most useful parts of the process because they exposed problems that were easy to miss in an otherwise convincing screen.
The application uses a relatively simple arrangement.
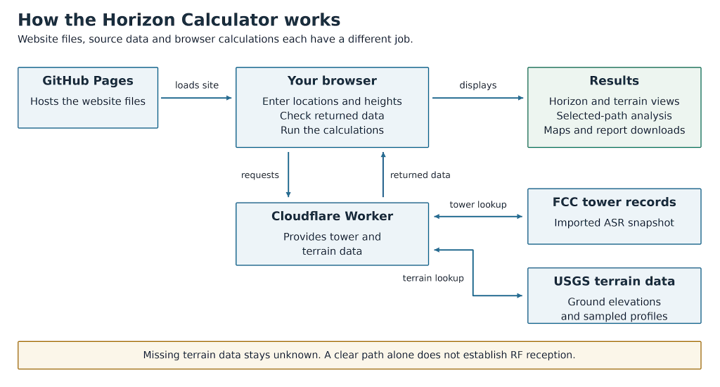
Figure 1. The current calculator: GitHub Pages supplies the website; the browser requests tower and terrain data through Cloudflare and calculates the results.
Adding terrain changed the question
A smooth-Earth horizon estimate can draw a useful circle around a tower. Real terrain makes the picture more interesting. A ridge can obstruct a path well inside that circle leaving a null on the other side.
The next development iterations added USGS ground elevations and sampled terrain profiles. That made it possible to select a receiver location and examine the path between two sites. A coarse 360-degree view followed, showing sampled areas around a site as terrain-clear, terrain-blocked or unknown.
This also introduced a distinction that the interface and reports needed to explain. Terrain that clears the modeled path does not establish that a usable signal will arrive. The current Beta examines sampled bare-earth geometry; with buildings taken into account via available Lidar data.
Testing the data behind the picture
One of the more instructive problems involved missing terrain samples. Some live responses omitted elevations near the receiver. Checking the endpoint helped reveal the issue, but fixing the endpoint alone still left an interior gap.
We changed the path workflow to request explicit positions and verify every returned elevation, including both endpoints. A point-to-point result now requires the complete set of requested samples. For a 360-degree scan, an unverified direction stays gray and the study is marked incomplete.
This exposed failures with USGS queries and required a different response. The tool added limited automatic retries and the ability to reuse previously verified terrain profiles. In a staged test across 24 directions, a rerun reused 23 successful profiles after one temporary failure. That preserved useful work while giving the failed request another opportunity.
Source information needed its own checks. A terrain dataset with one-meter raster resolution does not mean the calculator examines every meter of a path. The distance between the calculator’s requested positions is a separate measure. The reports now distinguish those two things and carry available USGS source details through to the exported results.
Several rounds of one last PDF
Data is more useful if you can take it with you, but the exports produced another round of development. A map that looked useful in the browser could lose overlays or arrive in a PDF with framing that made the study difficult to understand. A report about visibility around one site could also include stale information that belonged in the separate path report.
Reviewing the actual files led to focused fixes, separate one-page reports and automated checks intended to catch those problems if they return. It also caught a source-metadata problem that had survived earlier stages of the workflow.
There were several rounds of “one last PDF.”
Math, source data, readable exports, and traceable metadata each needed verification. The v2.0 Beta production release on October 29, 2026 brought the tested website and data service together, with recorded rollback versions, automated checks and fresh public-site tests.
What the calculator does today
You can begin with coordinates, a U.S. address or ZIP code, or an FCC Antenna Structure Registration Number. The FCC lookup uses an imported snapshot of registration records and identifies its import date. Review the selected location and use the actual antenna radiation-center height when available.
The tool offers three main ways to explore a site:
Estimate the horizon: Compare the geometric horizon with a standard radio-horizon approximation using the transmitting and receiving antenna heights.
Explore surrounding terrain: Run a coarse 360-degree scan to see which sampled areas clear the modeled terrain and where obstructions or missing data affect the result.
Examine a selected path: Choose a second location, inspect its terrain profile and explore alternative antenna-height adjustments for clearing the sampled terrain.
Remembering the many maps I made for NBC Owned Stations, results can be exported as CSV or KML, map images and separate one-page PDF reports hopefully saving time for someone. They exist for 360 visibility and point-to-point analysis. Those downloads make it easier to carry an initial exploration into a technical conversation.
What comes next
The next work includes further testing around the optional recovery window, which is designed to revisit temporary failures after a scan. Allowing the user to know retries are proceeding while continuing other work.
Population estimates are also on the roadmap. They could help describe the population within the modeled geography, provided the data source, vintage and method are clear. That number would describe people within an area; it would not establish reception or a measured audience.
I am also exploring more detailed propagation modeling, including how frequency, transmitter power and common operating scenarios could inform a future version. Those inputs will need a model that accounts for their effects and testing to establish what the results can support. Frequency and power are not part of the current calculation.
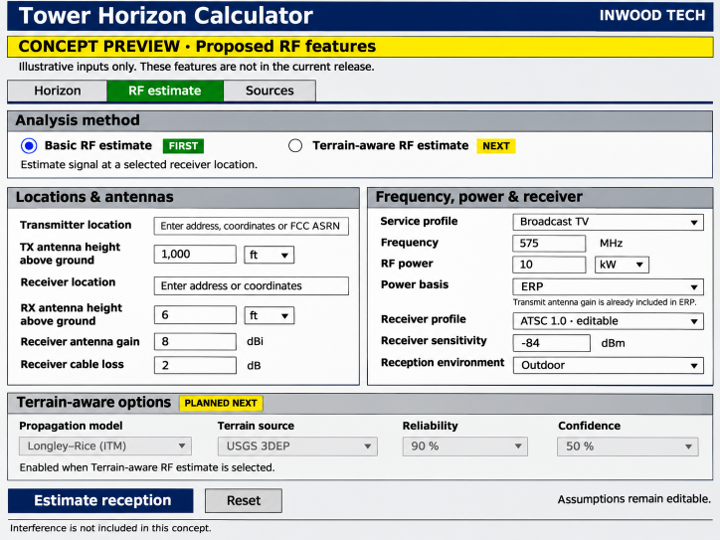
Figure 2. Proposed RF inputs: a basic reception estimate first, followed by a terrain-aware option. Concept only; these features are not part of the current release.
Feedback from people using real locations will help determine which improvements matter most. Try the Horizon Calculator and share an issue or suggestion. Include the locations, antenna heights and a screenshot or export where possible so I can reproduce what you are seeing.
The project README includes the implementation details, data credits, and release history.
Always consult a professional engineer.
